Obama's Failures
James Sherk of the Heritage Foundation claim only one fifth of the drop in the labor participation rate is due to demographic changes.
But...
The Federal Reserve Bank of Kansas analyst says it is almost half.
And the analyst for the one in SF says about half is due to the population aging..
But...
The Federal Reserve Bank of Kansas analyst says it is almost half.
And the analyst for the one in SF says about half is due to the population aging..
Last edited by will.15; 11-27-12 at 11:36 AM.
X
User Lists
This is the nonsense you get from the Heritage Foundation:
Demographic changes explain approximately one-fifth of the drop in labor force participation. The baby boomers are aging and thus more likely to retire, dropping out of the labor force. The remaining drop in participation primarily comes from millions more people going on disability insurance or attending school. While those enrolled in school will probably return to the labor force, those going on the disability rolls will not. They will remain permanently outside the labor force.
That is blatantly false. He got the one fifth number out of his ass. I can't see thst figure anywhere else and see no citation for it.
Last edited by will.15; 11-27-12 at 11:14 AM.
X
User Lists
That is blatantly false. He got the one fifth number out of his ass. I can't see thst figure anywhere else and see no citation for it.
Second, it is mentioned again (searching for "one-fifth" would've revealed it; how hard did you really look?). The hard data is in Table 4.
X
Favorite Movies
X
User Lists
Oh, he cites the Federal Board of Chicago's report? This is the beginning of that report:
Explaining the decline in the U.S. labor force participation rate
by Daniel Aaronson, vice president and director of microeconomic research, Jonathan Davis, associate economist, and Luojia Hu, senior economist
The authors conclude that just under half of the post-1999 decline in the U.S. labor force participation rate, or LFPR (the proportion of the working-age population that is employed or unemployed and seeking work), can be explained by long-running demographic patterns, such as the retirement of baby boomers. These patterns are expected to continue, offsetting LFPR improvements due to economic recovery.
So their conclusion is the same as the Kansas City report it is almost half, not one-fourth. I don't feel like digging through the report, but it sounds like he was cherry picking a number and quoting it out of context.
X
User Lists
You're all mixed up, dude. The Federal Board of Chicago report starts measuring in 1999 (it says so right there, in the part you posted). That's where the "almost half" figure comes from. The one-fifth figure is from 2008-2011, which is the relevant period for our purposes. In fact, the Heritage report is getting that number specifically from the data in the FBC report. He cites it and everything.
You really should apply some basic scrutiny to this stuff before jumping to conclusions. The idea that the Heritage report was just making stuff up doesn't even pass the smell test, and I took me all of 60 seconds to figure out where it was coming from.
You really should apply some basic scrutiny to this stuff before jumping to conclusions. The idea that the Heritage report was just making stuff up doesn't even pass the smell test, and I took me all of 60 seconds to figure out where it was coming from.
X
Favorite Movies
X
User Lists
You show me in the report where that comes from. It isn't there.
http://chicagofed.org/digital_assets...ch2012_296.pdf
The Kansas Federal Reserve Bank specifically discusses the recent decline and says the same thing as the conclusions of the Chicago Bank report.
http://chicagofed.org/digital_assets...ch2012_296.pdf
The Kansas Federal Reserve Bank specifically discusses the recent decline and says the same thing as the conclusions of the Chicago Bank report.
X
User Lists
I just looked again at the Kansas City report which uses the Chicago report and it specifically states the decline in the active labor participation rate from 2007-2011 is about half from demographic changes. I can't find anywhere any verfification for this one quarter number or one-fifth.
X
User Lists
Falling Labor Force Participation
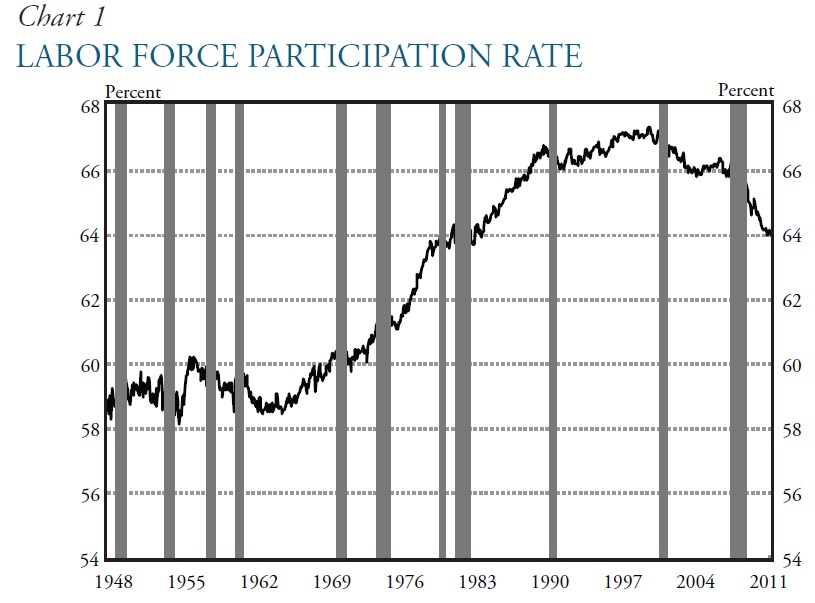
The percentage of the U.S. adult population that is either working or unemployed and looking for a job is called the labor force participation rate. From the early 1960s to the late 1990s, this percentage rose more-or-less steadily, from 59% to 67%. But since then, starting well before the Great Recession, the labor force participation rate has been falling. In my own Journal of Economic Perspectives, Chinhui Juhn and Simon Potter wrote about "Changes in Labor Force Participation inthe United States" back in the Summer 2006 issue. Willem Van Zandweghe has a more recent take, with updated evidence, in "Interpreting the Recent Decline in Labor Force Participation" in the Economic Review of the Federal Reserve Bank of Kansas City.
Here's the pattern of the labor force participation rate. The first figure shows the overall number. The second figure shows the breakdown by gender: that is, the declining labor force participation rate for men, and the women's labor force participation rate that was rising until about 2000, but then flattened out and has now declined.


How much of the recent sharp decline in the labor force participation rate is the Great Recession, and how much is other factors? "At the turn of the 21st century, labor force participation in the United States reversed its decades-long increase and started trending lower. A more startling development has been the recent sharp decline in the labor force participation rate�from 66.0 percent in 2007 to 64.1 percent in 2011�a far bigger drop than in any previous four-year period. ... This article presents a variety of evidence�including data on demographic shifts, labor market flows, gender differences, and the effects of long-term unemployment�to disentangle the roles of the business cycle and trend factors in the recent drop in participation. Taken together, the evidence indicates that long-term trend factors account for about half of the decline in labor force participation from 2007 to 2011, with cyclical factors accounting for the other half."
The percentage of the U.S. adult population that is either working or unemployed and looking for a job is called the labor force participation rate. From the early 1960s to the late 1990s, this percentage rose more-or-less steadily, from 59% to 67%. But since then, starting well before the Great Recession, the labor force participation rate has been falling. In my own Journal of Economic Perspectives, Chinhui Juhn and Simon Potter wrote about "Changes in Labor Force Participation inthe United States" back in the Summer 2006 issue. Willem Van Zandweghe has a more recent take, with updated evidence, in "Interpreting the Recent Decline in Labor Force Participation" in the Economic Review of the Federal Reserve Bank of Kansas City.
Here's the pattern of the labor force participation rate. The first figure shows the overall number. The second figure shows the breakdown by gender: that is, the declining labor force participation rate for men, and the women's labor force participation rate that was rising until about 2000, but then flattened out and has now declined.

How much of the recent sharp decline in the labor force participation rate is the Great Recession, and how much is other factors? "At the turn of the 21st century, labor force participation in the United States reversed its decades-long increase and started trending lower. A more startling development has been the recent sharp decline in the labor force participation rate�from 66.0 percent in 2007 to 64.1 percent in 2011�a far bigger drop than in any previous four-year period. ... This article presents a variety of evidence�including data on demographic shifts, labor market flows, gender differences, and the effects of long-term unemployment�to disentangle the roles of the business cycle and trend factors in the recent drop in participation. Taken together, the evidence indicates that long-term trend factors account for about half of the decline in labor force participation from 2007 to 2011, with cyclical factors accounting for the other half."
X
User Lists
Page 3, center column, last paragraph:
I can only assume the confusion is because Heritage is both referencing this report and doing its own research (with freely available Census data) so that it can control for demographics. That data is in the aforementioned Table 4. Heritage shows what employment would look like if you held the 2007 demographics constant through 2011. It references the Chicago Fed report to point out that it came to a similar conclusion about the same general time period.
I can only semi-speculate as to why the Kansas City Fed comes to a different conclusion: the "half" estimate seems to be based just on age distribution, and not "demographics." I would have assumed these terms were pretty much interchangeable, but given the disparity of the estimates, maybe not. But whether the difference is in its statistical model, or what it's actually trying to measure, it's obviously out of step with both Heritage and the Chicago Fed report.
"Indeed, over the 2008�11 period, we find that only one-quarter of the 1.8 percentage point decline in actual LFPR for 16�79 year olds can be attributed to demographic factors."And before you kick up a fuss about the age range, that actually means it's even worse; participation rates get lower after 55.
I can only assume the confusion is because Heritage is both referencing this report and doing its own research (with freely available Census data) so that it can control for demographics. That data is in the aforementioned Table 4. Heritage shows what employment would look like if you held the 2007 demographics constant through 2011. It references the Chicago Fed report to point out that it came to a similar conclusion about the same general time period.
I can only semi-speculate as to why the Kansas City Fed comes to a different conclusion: the "half" estimate seems to be based just on age distribution, and not "demographics." I would have assumed these terms were pretty much interchangeable, but given the disparity of the estimates, maybe not. But whether the difference is in its statistical model, or what it's actually trying to measure, it's obviously out of step with both Heritage and the Chicago Fed report.
X
Favorite Movies
X
User Lists
I think you're missing the big story here, though: you've conceded the initial point of dispute. The claim was that we've had an unprecedented drop in labor force participation, and that this artificially lowered the unemployment rate. And that's clearly true. We can debate about whether or not a fifth, a fourth, or a half of this would have happened anyway, but even the rosier estimates show that a good deal that it can't be explained away by long-term trends. QED.
X
Favorite Movies
X
User Lists
If half of it is cyclical changes, that is what happens during a recession, cyclical changes, and it also means the claims the real unemployment rate is ten percent, eleven percent, or 14 percent is bogus. Are you arguing if half of the drop in the active participation labor force is half, that is unusually high for a recession? Because nobody I can tell is arguing that.
I am having trouble with my computer with regard downloading the reports from pdf files, it keeps freezing and I have to restart now seversl times. But I will try to look at that report again. But on the surface, he really seems to be cherry picking and distorting the main point of that report.
I am having trouble with my computer with regard downloading the reports from pdf files, it keeps freezing and I have to restart now seversl times. But I will try to look at that report again. But on the surface, he really seems to be cherry picking and distorting the main point of that report.
X
User Lists
Okay, I notice he counts the larger 1.8 number for four years, but the latest number for one year is 1.1, which means there was an increase in the labor force, and you take one fourth from that you don't have mich of a discrepency. Really. You think that is a fair application of what that report says?
X
User Lists
If half of it is cyclical changes, that is what happens during a recession, cyclical changes, and it also means the claims the real unemployment rate is ten percent, eleven percent, or 14 percent is bogus.
"If the participation rate were at its trend, the unemployment rate would have averaged 10.7 percent in 2010, compared with the actual average of 9.6 percent. In 2011, unemployment would have averaged 10.0 percent rather than its actual 8.9 percent."I'm not sure how one would argue about what the "real" rate is, either. The very idea is a misnomer; each number measures different things, all of them potentially relevant to determining the health of the labor market.
Are you arguing if half of the drop in the active participation labor force is half, that is unusually high for a recession? Because nobody I can tell is arguing that.
I am having trouble with my computer with regard downloading the reports from pdf files, it keeps freezing and I have to restart now seversl times. But I will try to look at that report again. But on the surface, he really seems to be cherry picking and distorting the main point of that report.
X
Favorite Movies
X
User Lists
Okay, I notice he counts the larger 1.8 number for four years, but the latest number for one year is 1.1, which means there was an increase in the labor force, and you take one fourth from that you don't have mich of a discrepency. Really. You think that is a fair application of what that report says?
X
Favorite Movies
X
User Lists
It is from the paragarph directly abovie from what you cited in the Chicago Federal Reserve Report. The actual number for late 20ll for a discrepency in the reduction of the labor participation rate is 1.1, not 1.8, which is the average over four years. If the discrepency unaccounted for demographic changes is still one-fourth, you end up with less than a percentage point unexplained.
X
User Lists
No, the 1.1% number is not before the demographic trend is taken out, it's after ("LFPR for 16�79 year olds is 1.1 percentage points below trend LFPR"). When you say it'd be less than a percentage point (which is actually a lot when you're talking about participation rate), you're counting the demographic adjustment twice.
X
Favorite Movies
X
User Lists
Actually, the Kansas City Fed report says pretty much exactly that on page 25:
But that is not a real rate because the trend is not that. Romney and Winter cited the higher number as the actual unemployment rate. And it would by using the trend numbers also have been much highr under Bush.
I'm arguing that the overall drop in participation is unprecedented (both Fed reports say the same, I believe, and glancing at any chart depicting the rate shows as much). Therefore the unemployment rate, which has no way to incorporate this historic drop, is an inadequate measure by itself. That was the argument, and it seems pretty firmly established now.
Yes, and the Fed reports attribute half the decline to demographic changes. The first baby boomers hit 65 in 2011.
How? The point of that report is that half the change since 1999 (might be 2000, but either way) is due to demographic changes. But the question is what part of this recent sudden drop is. And it would appear that Heritage and the Chicago Fed have come to very similar conclusions on that question. The only major discrepancy happens when you compare two totally different timescales...but why would you?
"If the participation rate were at its trend, the unemployment rate would have averaged 10.7 percent in 2010, compared with the actual average of 9.6 percent. In 2011, unemployment would have averaged 10.0 percent rather than its actual 8.9 percent."I'm not sure how one would argue about what the "real" rate is, either. The very idea is a misnomer; each number measures different things, all of them potentially relevant to determining the health of the labor market.
But that is not a real rate because the trend is not that. Romney and Winter cited the higher number as the actual unemployment rate. And it would by using the trend numbers also have been much highr under Bush.
I'm arguing that the overall drop in participation is unprecedented (both Fed reports say the same, I believe, and glancing at any chart depicting the rate shows as much). Therefore the unemployment rate, which has no way to incorporate this historic drop, is an inadequate measure by itself. That was the argument, and it seems pretty firmly established now.
Yes, and the Fed reports attribute half the decline to demographic changes. The first baby boomers hit 65 in 2011.
How? The point of that report is that half the change since 1999 (might be 2000, but either way) is due to demographic changes. But the question is what part of this recent sudden drop is. And it would appear that Heritage and the Chicago Fed have come to very similar conclusions on that question. The only major discrepancy happens when you compare two totally different timescales...but why would you?
X
User Lists
But that is not a real rate because the trend is not that.
Romney and Winter cited the higher number as the actual unemployment rate.
But this is neither here nor there. I'm not trying to defend whatever random pronouncement people have made about which measure to use. I'm simply saying that you can't use the unemployment rate by itself to assess the health of the labor market. We agree on this now, yes? Because I don't think we did before.
And it would by using the trend numbers also have been much highr under Bush.
Yes, and the Fed reports attribute half the decline to demographic changes. The first baby boomers hit 65 in 2011.
The Chicago Fed doesn't agree with Heritage. Their conclusions are entirely different. The Heritage guy cherry picked out a number. But the last year in the period, 2011, was half the number. If we are looking at 1.1 instead of 1.8, it is a big difference.
And it seems beyond argument that the Chicago Fed agrees with Heritage, at least roughly. Heritage says controlling for demographics, a fifth of the drop from '07 to '11 would've happened anyway. The Chicago Fed says from '08 to '11, a fourth would've happened anyway. What's the issue, exactly? It's cherry-picking because, at first glance, you didn't realize that the mention of half was referring to a different time period?
If the number in the last year is half, what is it this year? If that is cyclical and the unemplyment rate is less this year, then what is it now that can't be explained by demographic changes, half a percent? It hardly becomes something worth arguing about.
X
Favorite Movies
X